-
16
Dec
Plunge in US Imports Accelerates; Volumes Near Pre-Covid Levels
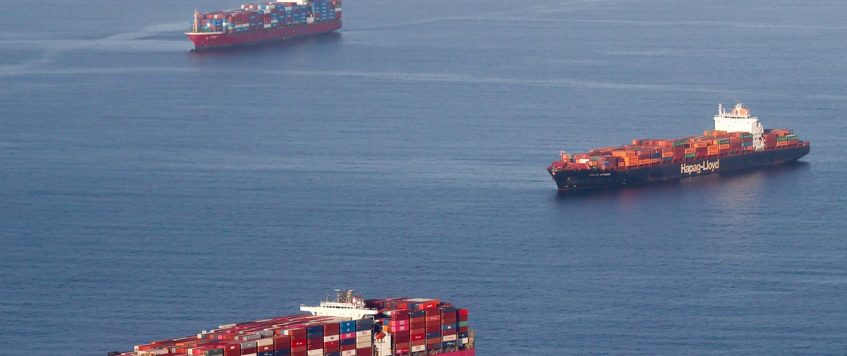
The situation remains far from normal at some U.S. ports. There were still 18 container ships at anchor waiting for a berth in Savannah, Georgia, on Monday. But for the country overall, weakening inbound cargo volumes are bringing imports close to where they were before the pandemic-induced spending splurge.
Descartes reported Monday that 1,954,179 twenty-foot equivalent units of containerized cargo were imported in November. That’s down 12% month on month (m/m) and 19.4% year on year (y/y). It’s only 2.8% higher than imports in November 2019, pre-COVID, and down 37% from the May peak.
Imports typically decline in November versus October — but not by this much. This year’s m/m November drop is the steepest recorded by Descartes since 2016.
Weakening exports from China have been a key driver of lower U.S. port numbers. That trend continued in November. U.S. imports from China dropped by 85,926 TEUs or 11.1% versus October, according to Descartes.
However, China was only part of the story. Import source declines were widespread, pointing more toward weakening demand than China-specific lockdown issues.
Descartes’ data shows a 30.8% m/m drop in imports from Thailand (down 25,281 TEUs) and a 17.4% drop from Vietnam (down 31,489 TEUs). Imports also fell from Germany, Taiwan, Hong Kong, Italy, India and South Korea.
Ports on all coasts suffer declines
The fall in countrywide imports since the peak has been heavily weighted toward West Coast ports. The West Coast’s slide continued in November. Descartes calculated that import volumes in California fell 15.4% m/m in Long Beach, 14.5% in Oakland and 7% in Los Angeles.
But the stats also show declines spreading to the East and Gulf Coast ports. Descartes reported a 16.5% m/m import drop in Charleston, South Carolina, with New York/New Jersey down 12.8%; Norfolk, Virginia, 12.6%; Savannah 11%; and Houston 9.7%.
Nevertheless, there continues to be a wide disparity in ship wait time between the coasts. West Coast ports are under much less pressure, with much shorter wait times.
According to Descartes data, the average wait times at the top five West Coast ports in November was 6.94 days, down 15% m/m and less than half the peak wait times recorded in February.
The average wait time at the top five ports on the East and Gulf coasts was 9.96 days, down 6% m/m and 29% from the February peak. This is still 44% higher than the West Coast average, underscoring how far some ports remain from pre-COVID normalcy.
Different sources, different import numbers
U.S. import data is published by numerous sources, including Descartes, PIERS, the McCown Report, Panjiva and Port Tracker from the National Retail Federation (NRF), as well as official TEU counts from the ports themselves. Each source comes up with different totals and change percentages.
Some use Customs data, others use the port counts. The McCown Report covers the top 10 ports. The NRF covers 12. Descartes, PIERS and Panjiva cover all ports.
Differences may also arise from ships unloading at the very beginning or end of the month. Some data providers may include all or a portion of these ships’ containers in one month, others in the following month.
Port of Los Angeles spokesperson Phillip Sanfield told American Shipper that the port gets its TEU counts from its terminals, not Customs. In Los Angeles, a ship’s imports are accounted for based on a vessel’s arrival date, not when boxes are actually unloaded. “If a ship arrives on Dec. 31 and doesn’t leave until Jan. 6, those imports are counted in December,” Sanfield explained.
Combine these accounting and data differences with the huge swing in volumes over the past year and the various sources’ numbers can increasingly diverge.
Panjiva put November imports at 2.2 million TEUs, considerably higher than Descartes. It shows November imports down 8% m/m and 18.5% y/y. Port Tracker’s preliminary estimate for November is 1.85 million TEUs, down 7.5% m/m and 12.3% y/y — less than half the y/y decline reported by Descartes.
According to the McCown Report, imports fell 9.4% y/y in October. Descartes said U.S. imports were up 0.2% that month.
Descartes said that October imports to Savannah increased 5.3% versus September. The official port count showed a 25% increase. Descartes said Long Beach imports fell 2.7% m/m in October. The Port of Long Beach reported that imports fell 14%.
‘Next six months will see further declines’
As with spot shipping rates indexes, import reports vary due to differing methodologies and data sources, yet the directional trend they reveal is generally the same over time.
The direction shown for import volumes is back to pre-pandemic levels, a trend that continues this month. Real-time U.S. Customs data measured in TEUs from FreightWaves SONAR shows volumes in the first half of December at or below November levels.
According to Ben Hackett of Hackett Associates, which publishes the monthly Port Tracker report with the NRF, “The next six months will see further declines to a level not seen for some time.” Port Tracker now projects that import volumes in February and March will be down 20.9% and 18.6% y/y, respectively.
By: Greg Miller / FreightWaves

- +1-717-626-1107
- sales@pnglc.com